2018 Report on Giving: By the Numbers
Jasmine Jones
Published: 01/02/2019
What is the Report on Giving?
The Report on Giving is a yearly survey project that the Association for Healthcare Philanthropy conducts to collect data on health care-related philanthropic activities. Survey participation is available for free to members and non-members from any entity
type or size. AHP has been publishing the Report on Giving since 1984.
Here are some highlights pulled from the 34th edition of this report, covering data from fiscal year 2017 and released on November 16, 2018:

Total Funds Raised
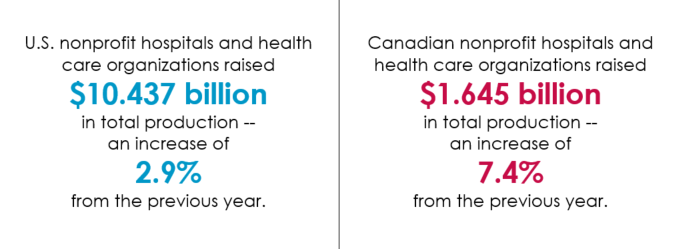
During the 2017 fiscal year, we saw an increase in total funds raised – the highest-ever totals for each country.

The Bureau of Economic Analysis found that gross domestic product increased by 2.2 percent and the Association for Fundraising Professionals also estimated an increase of 2.2 percent in total funds raised for the nonprofit sector. This shows AHP’s
data is keeping up with economic and nonprofit trends.
Return on Investment
Return on investment (ROI) is an indicator of fundraising efficiency or productivity and is calculated by dividing gross funds raised by total fundraising expenses. The 2018 Report on Giving found variations in ROI as well.

In the U.S., ROI slightly decreased from fiscal year 2016’s value of $4.06. AHP found an opposite trend in Canada, as ROI increased from $4.07 from last fiscal year.
Cost to Raise a Dollar
Cost to raise a dollar (CTRD) is also a tool used to measure fundraising effectiveness. It is the inverse of ROI, calculated by dividing total fundraising expenses by gross fundraising revenue. In fiscal year 2017, CTRD saw similar numbers as the previous
years of data collection.

In the U.S., CTRD stayed the same at $0.25 over fiscal year 2016. Contrarily, Canada’s CTRD value slightly decreased from fiscal year 2016’s value of $0.25.
What are high performers?
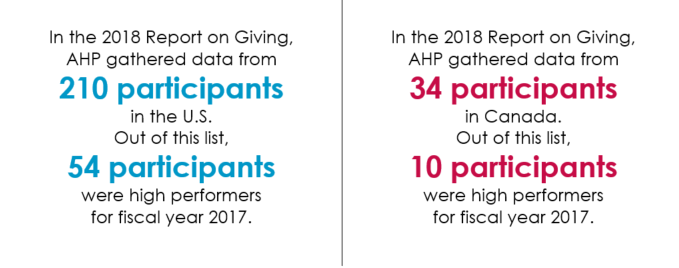
AHP selects a list of high performers every year to highlight those organizations who are striving to raise the standards in the health care philanthropy industry. These organizations represent the top 25 percent in net production returns. They raised
more than $12.4 million in the U.S. and more than $14 million in Canada and represented a median of $27.29 million in the U.S. and $19.61 million in Canada in net fundraising returns. To
see the 2018 list of high performers, visit ahp.org/highperformers.
How did high performers do?
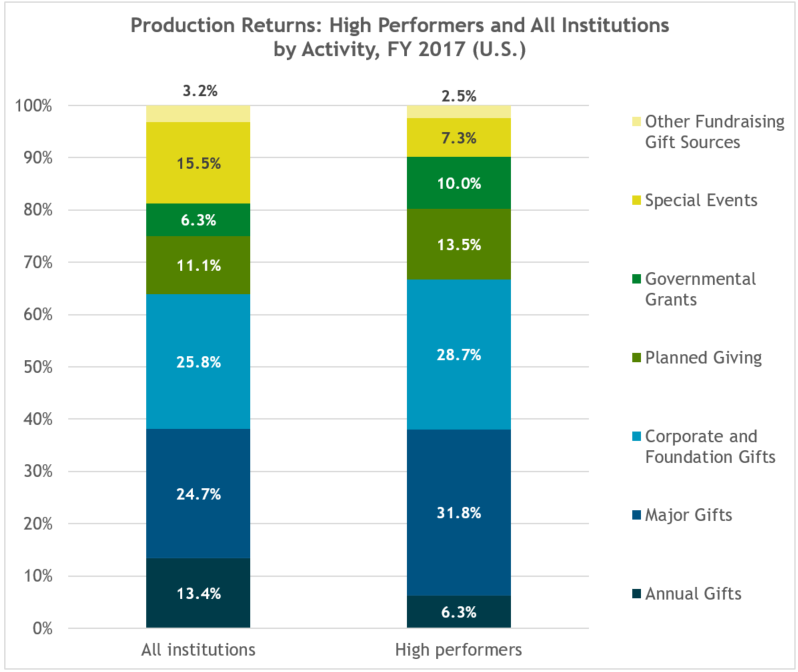
In the U.S., high performers saw greater percentages in production returns with government grants, planned gifts, corporate and foundation gifts and major gifts.

Overall takeaways from U.S. high performers tell us that including more major gifts, planned gifts and governmental grants in an organization’s fundraising portfolio may lead to higher fundraising returns, as these gift types typically
have higher funds raised per gift that annual gifts or special events. Additionally, more fundraising FTEs and efficiently spent direct fundraising expenses used positively impacts fundraising performance, the latter resulting in
a higher ROI and net fundraising revenue and a lower CTRD. High performers also typically engage in more capital campaigns than other organizations (62.5 percent vs. 50.5 percent respectively) and have a higher total number or donors than other organizations (median of 9,423 vs. 3,878 respectively).

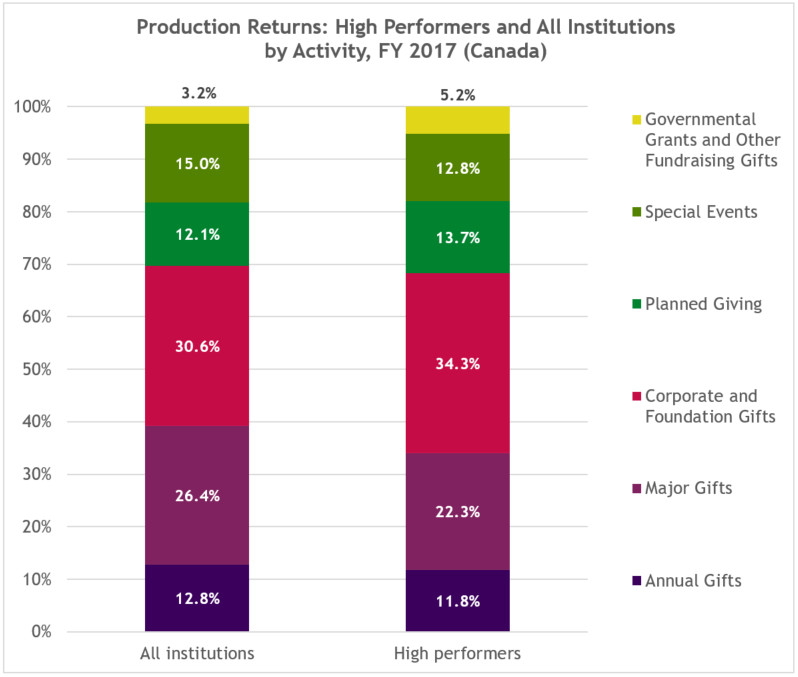
From Canadian high performers, we can see that including more corporate and foundation gifts in an organization’s fundraising portfolio may lead to higher fundraising returns, as these gift types typically have higher funds raised
per gift than annual gifts or special events. Additionally, more fundraising FTEs and efficiently spent direct fundraising expenses used positively impacts fundraising performance, the latter improving net fundraising revenue and
funds raised per direct FTE. High performers also typically engage in more capital campaigns than other organizations (66.7 percent vs. 52.9 percent respectively) and have a higher total number or donors than other organizations (median of 11,155 vs. 6,355 respectively).
If you’re interested in viewing this information in depth, the published 2018 Report on Giving is available now. Participants receive a complimentary copy of this report when they
sign up for the survey. If your organization is interested in participating in the survey or would like to know more about the process, please reach out to AHP’s Research Specialist Jasmine Jones at jasmine@ahp.org for more information or visit our Report on Giving page.
On-demand Learning Hub
Explore all our resources on this and many other topics in the On-demand Learning Hub